
Create a Collage
With iNMR you can arrange many plots, of whichever nature, into a bigger picture. For example, you can create a report with the 1H spectrum, the 13C, a particular of a 2D spectrum, a paragraph of text, the chemical formula, etc... You can go further and even create a whole poster with iNMR alone. Many of the elements (text, pictures, titles, frames...) will be Document Notes that are explained elsewhere. Here you will be introduced to the concept of Replicas, that allows the combination of different NMR plots. We'll arrange four independent spectra into the same sheet. In our very simple example, the four spectra are actually the same file that has been duplicated 4 times into the Finder. The four plots will all have the same size. That will be enough to learn the management of replicas. Actually, the mechanism is much more general and the size, location and proportions of each sub-plot are modified independently.
You need version 2.4.5 of iNMR to repeat the tutorial.
Take a simple data-set, corresponding to a 1-D FID. We are considering the case of a Bruker or a Varian spectrum (the data set is a folder). Duplicate it 4 times and rename the copies as: black, blue, red and green. Drag them onto the iNMR icon. iNMR opens 4 windows. Go to “blue” because it will be our working field. If the FID is not blue, make it so (Format/Levels & Colors...). Choose a page size with the standard command “Page Setup”. Open the Overlay Manager (Format/Overlay...). We'll do everything from inside this dialog.
Change the color to the remaining windows, by clicking the colored rectangle at the left. (Make the colors correspond to the names, of course). Double click each name: you'll see the word “REPLICA:” appearing before them. In the column “h. offset” write “50%”, into a single row. Don't forget the “%” sign. Also in the column “v. offset”, but into a different row, write “50%”. You'll see that iNMR will change your input. It's OK. On my computer, the offsets changed into 391 and 279. They correspond to the 50% of the width and the 50% of the height of the “blue” window. Check the button “All Windows” at the left, under the table. To reduce the size of the external windows I write “391x279” into the last column, in all the rows:
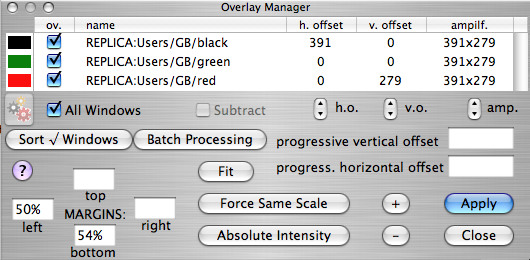
The two numbers have been taken from the first two columns. Quite likely, your numbers are different: use yours, not mine! It is not necessary to type them each time. You can copy the text from the first row and paste it into the other rows. To resize the blue plot enter “50%” into the field called “left” and “54%” into the field called “bottom” (they are at the bottom-left corner of the dialog), then hit “Apply” (the big colored button).
Congratulations: your collage is finished!
Playing with the plots
To better familiarize with the dialog, you can experiment with the other controls. Select a row (click into the name), then click the small arrows below the table to relocate or resize the corresponding plot. To change the intensity of the peaks, first select a row in the table, then use the buttons called “+” and “-”, or the button “Fit”, whose effect is equivalent to a double click inside the corresponding external window. You can also close the dialog and manipulate the external windows directly. All the changes will be reflected into the replicas. Remember that each replica is as large as the corresponding window. To rotate through all the windows, when the Overlay Manager is closed, press “1” or “2” (not both).
Start on the Right Foot
It's important to set the right dimension (paper size) before arranging the replicas. We did it with the command “Page Setup”. It leaves the window in fixed size mode, that's what we need. The windows that corresponds to the replicas are forced into the Free Size mode by iNMR itself (you should not worry). The receiving window can become a container, if you hide everything (scale, integrals, etc..). To hide the spectrum you can resize the margins, decrease the intensity, set the color to white... or, better, read the chapter on containers at the bottom of this page! In this way any window can become an improper container. The container, once properly filled, becomes a nice poster. iNMR is not even remotely as powerful as PowerPoint, yet has three indisputable advantages:
- If you modify any of the individual spectra, the poster is automatically updated.
- No loss in resolution is possible.
- iNMR is faster.
A Conceptual Difference
When you specify the size of a replica, you can be sure that nothing will be drawn outside those bounds. When you specify the margins for the local spectrum, instead, you are only mapping the ppm range onto the window. Many elements, like tall 1-D peaks, the frequency scale, document notes, etc... can go outside. Almost all of them can be repositioned with the mouse (not the tall peaks, however...). There is no such a problem if you work with a proper container, es explained below.
Proper Containers
Press Cmd+Alt+N. iNMR will ask you about the paper size, then creates an empty container. This special document responds to the regular commands but the spectrum remains invisible. Comments and replicas, however, are visible and editable. The advantages of a proper container are:
- Replicas can be dragged and resized directly with the mouse.
- New annotations are automatically Document Notes.
- You can't accidently convert a replica into an overlay.
- A container can be recognized in the Finder by the different icon.
- The Page Setup dialog appears automatically.
Remember that a container, like any NMR file, never holds a spectrum, but only references to external files.