What's Happening ? (part 2; Automatic Integration)
In the first part of this series (Baseline Correction) you discovered the map that iNMR creates internally to discriminate between peaks and baseline. The same map is also created to perform automatic integration (1D only). This time, however, you have no control on what's happening. If you are curious, iNMR sets the “moving average filter” to the number of points in the spectrum divided by 2048. This value may change in future. It's not critical, because you can obtain a similar, even stronger, effect with one of the provided sliders.
The dialog for Automatic Integration shows 3 of such sliders. They correspond to an identical number of filters, applied in this chronological order:
- minimal width;
- merging distance;
- maximum allowed ratio.
This is also the order of the controls, from top to bottom. A filter can eliminate one or more regions, but can't create new ones. If a region is filtered out by the first filter, it can't be brought back in life by the following ones. To disable all filters, move the top slider and the middle one to the far left and the bottom slider to the far right. You will see the famous "map" directly translated into integration regions.
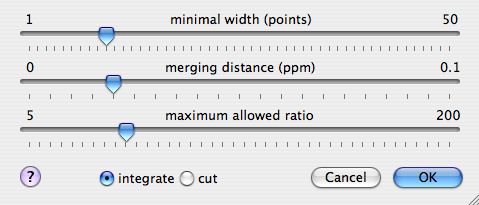
- minimal width
- This filter eliminates the narrower regions. The end of the run is at the value of 50 points. If the regions are large (more than 50 points), you will see no effect. You can press the key “n” to display the scale in this unit.
- merging distance
- Properly speaking, this is not a filter, because it modifies the regions, adding more space on both sides. If two regions enter in contact during the expansion, they are merged. This is the mechanism that makes this stage behave like a filter. This slider is the most important one and it always has an effect. The maximum space you can add is 0.1 ppm for each side of each integral.
- maximum allowed ratio
- This filter compares the values of the integrals and eliminates the smaller ones (the regions containing the lower peaks). The tallest peak is the reference. This phase also affects the normalization of integrals. For example, if you set the slider at the value=120, the integral label under the most intense integral will read exactly 120. Any integral that, in this normalized scale, is worth less than 1.0 is filtered out. Move the slider to the right and the weak integrals will come back into existence.
There is very little math behind this dialog! The most complicated part is not controllable and has already been performed by the time the dialog appears.