|
|
|
|
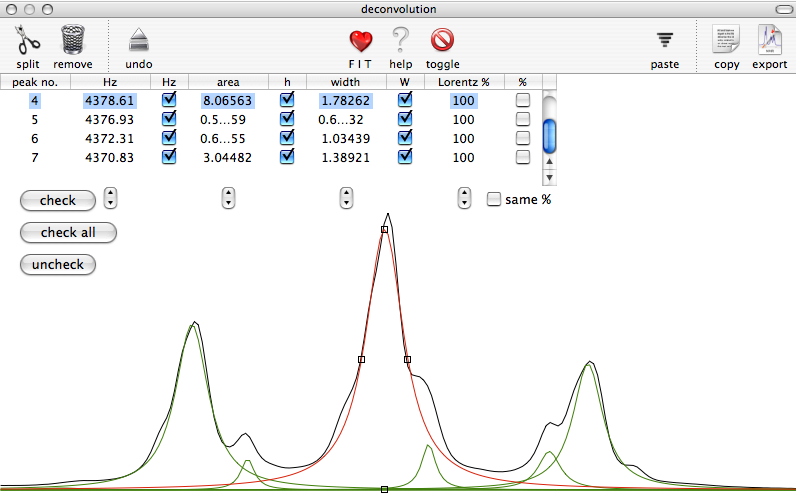
| When you need to measure the intensity of overlapping peaks, you can fit them either visually or mathematically. This module has more options than is possible to show in a single picture. The best feature is probably the freedom to expand this window to full screen size. Peaks are fitted with a mixed Lorentz-Gauss function. You also have the option of showing the simulated spectrum, the difference and the value of the residual error. |