Can't Process a 2-D Spectrum?
You can’t process a 2-D spectrum and don’t have a clue where to start?
You need to diagnose your problem! Have you got a rough idea of what to expect?
What is the problem exactly with what you are seeing? The diagnosis is vital,
because the remedy follows directly from the diagnosis.
Carefully observe the results you get. Learn to explore the 2-D matrix, both in time and frequency domains.
Do you have a 1-D spectrum of the same sample for comparison? Are the same peaks visible in the 2-D plot? Are they in the same relative order? If you have no 1-D equivalent, could you possibly find a spectrum of a similar compound?
The majority of 2-D spectra today are acquired in phase-sensitive mode (which means you can get pure absorption signals through phase correction) although there are still many spectra which can’t be acquired in this mode. It all depends
on the pulse sequence (not on the spectrometer) and is something you should know
(if you don’t, ask the operator who acquired the spectrum).
Here we propose a diagnostic path. However, if you are still unable to solve the problem by yourself, please do not hesitate to contact us via email (command: Help > email support).
What You Should Verify
- First try the default processing. When you reach the end, choose View > Full, then double-click inside the plot. If you only see the background, press the plus key. If you can’t see the background at all, press the minus key. If the phase can’t be corrected, choose Process > Magnitude. First you need to know if the peaks are appearing in the correct order.
- If the number of peaks looks plausible but you can’t recognize the spectrum, try pressing Shift-T once or twice. This is a shortcut to transpose the matrix. Maybe you are used to seeing the spectrum the other way round.
-
If the peaks are not in the correct order or the number of peaks is wrong, restart from time domain.
Choose File > Reload. Alt-click under the horizontal frequency scale.
This creates a horizontal mark on the first row.
Choose File > Extract. A 1-D FID appears.
Transform it into the frequency domain and try correcting the phase manually.
Don’t worry if you can’t correct the phase now, but do make an attempt to change the shapes of the peaks until they are symmetric. Beware that some pulse programs can generate positive and negative peaks together. If you can recognize the normal 1-D spectrum (apart from the phase anomalies) skip the following paragraphs and move on to the next point.
If you can't recognize the 1-D spectrum, choose File > Repeat,
then Process > Fourier Transform.
Set the options shown here:
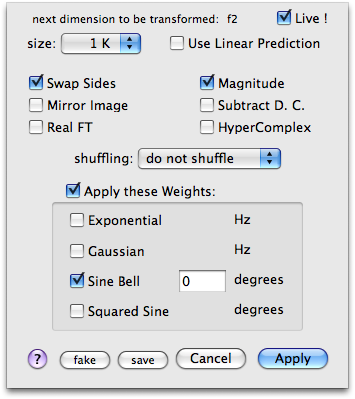 This kind of weighting is rather unusual and is not routinely used.
Can you now see the normal 1-D spectrum? Are the peaks in the correct order? Try clicking Mirror Image and see what happens. You can also try to Swap Sides and experiment with all the remaining combinations of these two options.
Shuffling and the options Hypercomplex and Balanced are never required when processing the direct dimension (f-2). Changing the window function or using Linear Prediction will not help. The final option (Real FT) is only required for spectra that come from obsolete Bruker instruments.
When you have found the correct settings, if you know that your spectrum is phase-sensitive, uncheck Magnitude and change the window function: set a (squared) sine bell shifted by 90°. Click Apply and correct the phase if possible.
- When the first row is OK, close the extract (command: File > Close Extract) and while keeping the same settings apply the FT, to the whole matrix.
- Choose an intense column from the half-transformed matrix with ⌘-click (on the Mac) or Alt Gr-click (on Windows). If it is a homonuclear correlation experiment, choose File > Extract. Otherwise, choose File > Collapse. On the Mac, this command appears when you hold down the alt key.
- Return to the FT dialog and work again in Live! mode. This time you should see only a single peak (the diagonal peak) if the 2-D spectrum is a homonuclear correlation experiment. If you had chosen Collapse in the previous step, you should see something similar to the 1D spectrum of the nucleus that corresponds to f-1.
- If the spectrum is NOT phase sensitive, choose Magnitude and do not shuffle. A suitable weighting function to apply is the (squared) sine bell (shift = 0°).
- If the spectrum IS phase sensitive (along the Ruben-States or the TPPI modes), choose Hypercomplex and phase sensitive. A suitable weighting function is the squared (co)sine bell (shift = 90°).
- If the spectrum is phase sensitive according to Rance-Kay, choose echo-antiecho instead of phase sensitive. A typical example is the gradient-enhanced HSQC.
- In the case of Bruker spectra, the option Mirror Image is unlikely to ever be necessary. Use Real for TPPI spectra and Swap Sides for Ruben States spectra. Don’t use either of the above options for States-TPPI spectra.
- When the matrix is fully transformed, if the spectrum is phase-sensitive apply the automatic phase correction. Sometimes the algorithm stops prematurely: apply it again. In all cases, manual phasing will produce better results.
- Generally, it will be necessary to further clean up the spectrum. This is usually achieved with a baseplane correction. The default parameters are OK. The remaining treatments (noise removal, symmetrization, etc) can also be tried. See for yourself how the spectrum is altered using these additional cosmetic tricks.
A different procedure should be followed for 3-D processing.